Methodology

The impacts of future climate change on farming systems are complex and uncertain. Policy-makers need actionable information in order to ensure future food security. They must be well informed of regional conditions and adaptation options so national policies will support local actions for improvement.

The Agricultural Model intercomparison and Improvement Project (AgMIP) is an international collaborative effort to improve agricultural modelling and to understand climate impacts on the agricultural sector at global, national, and regional scales.

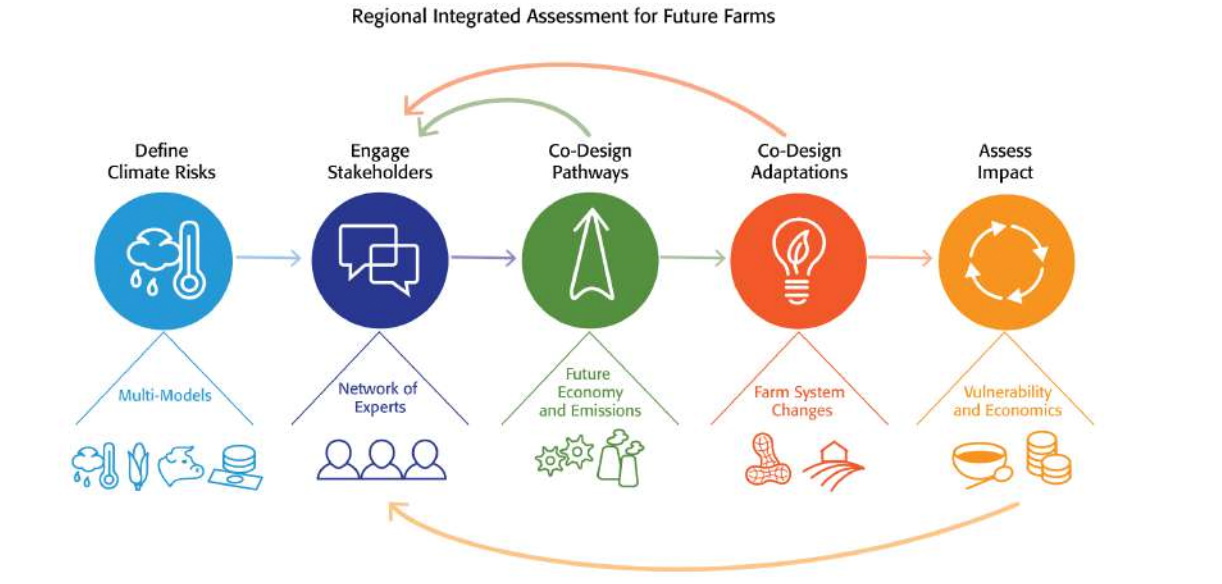
The integrated assessments conducted in the regional and national studies connect information from climate, crop and economic model simulations, and knowledge from experts and stakeholders. They give insight in the vulnerability of these complex systems and test adaptations to improve farmers' livelihoods.

This section explains important elements of the AgMIP methodology.
 

Core research questions

AgMIP has identified four core research questions  that guide research activities for regional integrated assessments. Each question is designed to allow comparison between two different production states: climate vulnerability in the current world, climate adaptation in the current world, climate vulnerability in the future world, and climate adaptation in the future world.  The future period represents mid-century. Impact indicators may include crop and livestock yields, value of production, poverty, or net farm or household income.

In the AgMIP regional studies only the most relevant of these core questions are fully elaborated.

Current agricultural system

Q1: What is the sensitivity of current agricultural production systems to climate change?

This question addresses the isolated impacts of climate changes assuming that the production system does not change from its current state.

Responsive Image

Q2: What are the benefits of adaptation in current agricultural systems? 

This question addresses the benefit (e.g., economic and food security resilience) of potential adaptation options to current agricultural systems given current climate.

Responsive Image

Future agricultural system

Q3: What is the impact of climate change on future agricultural production systems?

Assessment of climate impacts on the future production system, which will differ from the current production system due to development in the agricultural sector.

Responsive Image

Q4: What are the benefits of climate change adaptations? 

Assessment of the benefits of potential adaptation options in the future production system.

Responsive Image

Science, policy and practice

The AgMIP methodology integrates results from scientific modeling with knowledge from agricultural and policy experts.

In regional integrated assessments, climate change impacts on the agricultural system of a region are simulated.  Stakeholders are involved to bring in knowledge to co-design pathways (RAPs, Representative Agricultural Pathways) and adaptation options (see next sections).
Responsive Image

National impact assessments are based on data, modelling results, formal procedures and expert judgment on agricultural production systems and future changes, for all regions of a country.

In the CLARE project, extensive stakeholder interviews and surveys were conducted to analyze national climate change planning for agriculture in Ghana, Senegal and Zimbabwe. The results of this analysis will guide future AgMIP studies and support policymakers in applying scientific knowledge in policy development.

Integrated assessments and scientific models

Integrated assessments

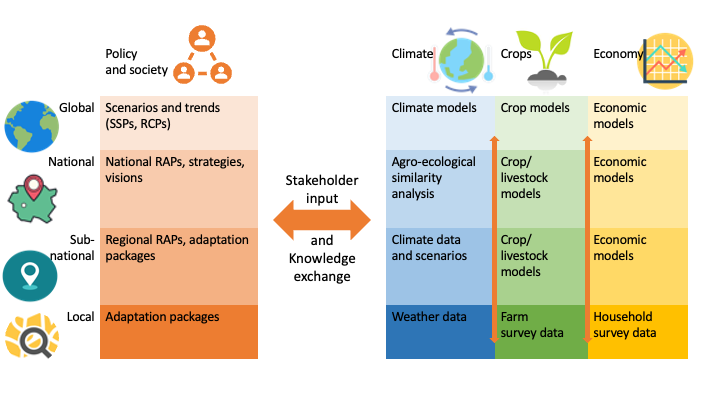
The AgMIP integrated assessments apply scientific models and stakeholder expertise to estimate effects of climate change on crops and food security. This is an elaborate process: scientific models must simulate very complex real-life processes and require extensive sets of reliable input data. Different kinds of expertise (from science and practice) are necessary to validate, correct, fine-tune, and interpret the results.
Responsive Image

Toward National and Regional Integrated Assessment Protocols

The principal goals of National and Regional Integrated Assessment (NRIA) are to support a country’s ongoing National Adaptation Planning and related policy initiatives:

  • Analyze the country’s agricultural sector performance under alternative strategies to implement its national adaptation plan (NAP), using stakeholder-defined performance indicators; and

  • Complement and support regional integrated assessment (RIA) of agricultural system adaptation at the regional (sub-national) level by regional teams of stakeholders and scientists.

To achieve these two goals, NRIA begins with the identification of a set of scenarios to be modeled over a stakeholder-defined planning horizon. Each of these scenarios is comprised of two main components: a strategy for national adaptation plan implementation; and a future pathway comprised of projected future climate conditions (associated with Representative Concentration Pathways, or RCPs) and socio-economic conditions (represented by global Shared Socio-economic Pathways, SSPs, and national Representative Agricultural Pathways, RAPs).
NRIA uses quantitative modeling to evaluate the performance of the country’s agricultural sector and main agricultural systems for each scenario using stakeholder-defined performance indicators for each scenario. These indicators can be measures of agricultural productivity, prices, food consumption, etc.
A key methodological element of NRIA is the linkage of global and national models needed for national policy evaluation with the more detailed regional assessments needed to design and evaluate on-farm adaptations. A spreadsheet tool (National-Regional Interface) was developed for this purpose.

Responsive Image

Scientific models

Climate models

Climate models are an important tool for understanding the implications of societal emissions of greenhouse gases (such as carbon dioxide, CO2) that trap energy in our climate, raising global temperatures, shifting weather patterns, and altering the likelihood of extreme events.

Difference in climate models

Climate models vary in their representation of physical processes and have different levels of complexity and resolution

Historical climate data

Data from national environmental and meteorological agencies are collected and improved where necessary. The result is a daily time series of rainfall, maximum and minimum temperatures, solar radiation, wind speed, and humidity from 1980-2010 that may be used to drive crop and livestock models.
Historical meteorological station observations form the gold standard for historical weather and climate information used in the AgMIP Regional Integrated Assessments.  We work with national environmental and meteorological agencies to locate weather stations in our agricultural zones, then examine the data to identify any spurious values or gaps in the data.  These we replace with data from the NASA AgMERRA historical climate forcing dataset, adjusting for any monthly biases identified in a comparison between the available historical observations and AgMERRA. 

Climate scenarios

Climate scenarios are plausible representations of future climate conditions (temperature, precipitation, and other aspects of climate such as extreme events).
We cannot precisely predict the way that society, industry, and technology will develop in the coming decades, and thus we cannot precisely predict the amount of greenhouse gas emissions that will drive climate change (such as carbon dioxide, CO2).  Scientists therefore use climate models to project different scenarios of greenhouse gas levels in the atmosphere. These show the regional temperature and rainfall impacts that affect agriculture and food security.
 

Climate scenarios for the AgMIP Regional Integrated Assessments

Regional climate scenarios produced for the AgMIP Regional Integrated Assessments were designed to sample the most important aspects of regional climate change for the local agricultural sector.
A climate model was selected to represent the middle temperature and rainfall change projections for each region, and then four were selected to represent relatively hot and dry, hot and wet, cool and dry, and cool and wet projections compared to this middle scenario. 
This allows us to explore how a broad range of plausible climate projections affect regional agriculture.
We first sampled regional projections of growing season temperature and precipitation changes from a set of 29 global climate models, then selected 5 models for analysis that best represented the types of climate changes seen in the full set.  Note that "relatively cool" scenarios are still warmer than today as climate model projections for the 2050s are all warmer than present conditions, however these models do not project as great a regional warming and are therefore cooler than most other models.
Responsive Image

Climate scenarios for the AgMIP National Integrated Assessments

How were climate scenarios generated? 

For each selected climate scenario we compare the climate model projection of the 2040-2069 period (referred to as the "2050s") against the same climate model's 1980-2009 period. With the calculated changes in temperature and precipitation a time series is created that retains many of the day-to-day characteristics of the observed climate but also reflects the new averages and distribution that result from projected climate changes.
We calculate monthly changes in rainfall, maximum and minimum temperatures, the number of rainy days, and the standard deviation of maximum and minimum temperatures.  These quantities then allow us to alter the distribution of temperature and rainfall for each month according to the climate model projections.  To do this, we adjust the original observational time series, impose new mean temperatures and rainfall totals, shift the number of rainy days, and alter the frequency of extreme temperatures within the growing season.

Crop models


Crop models are computer programs that predict daily growth and development of crops in response to weather, soil conditions, crop management, and variety traits, throughout the cropping season. Crop models predict final yield and biomass and also many other variables related to the crop, soil, and environment. 

The crop models are not regression models, but rather simulate processes such as photosynthesis, leaf area growth, and grain growth, with a daily time-step.  The models are written in various programming languages and are coded and parameterized with relationships describing the sensitivities of processes to solar radiation, temperature, and available water and N.  The models require inputs of crop management, crop variety traits, soil physical and chemical properties, as well as daily weather.  The model outputs include daily plant growth and development, evapotranspiration, N dynamics, and other variables as well as final yield and yield components.

Responsive Image

Different crop models

Crop models have been developed by many different teams throughout the world, and the structure and theories used in those models differ according to the concepts developed by the model authors.  Models may therefore respond differently to, for instance, temperature, elevated CO2, rainfall, and management, which leads to different simulated model outcomes.

The models have different coding and parameterization for sensitivities of growth processes to solar radiation, temperature, water, and N supply.  The models often have different temperatures sensitivities (base and optimum temperatures) for simulating various processes such as photosynthesis, leaf area expansion, and grain growth rates, in part based on how the model developers interpreted sparse published literature.  This can cause different model responses to temperature.  Models may have different parameterization for the photosynthesis and transpiration sensitivity to elevated carbon dioxide, thus resulting in differences among models in response to elevated CO2.  While the weather and management inputs should be the same, the models typically have different ways of interpreting how the crop predicts soil water balance and evapotranspiration, how the soil organic C pools are available for mineralization of N, and how the crops handle N uptake for growth.  This can cause variation among models in their sensitivity to rainfall, water supply, and N fertilization.

For more detail on the use of crop models and the AgMIP protocols for model intercomparisons: (NB links to be updated and included)

Responsive Image

RAPs (Representative Agricultural Pathways)

Scenarios and pathways

To prepare effective strategies and action plans, policy makers and practitioners want to look ahead. How will the agricultural sector evolve in the 21st century? What are the effects of climate change, economic policies and farm-level management adaptations? Scenarios and pathways are instruments to help answer this question.

Scenarios are images of the future, or alternative futures. They are not predictions nor forecasts but show how the future might unfold.  The goal of working with scenarios is to better understand uncertainties and alternative futures, in order to consider how robust different decisions or options may be under a wide range of possible circumstances.
Scenarios consist of step-wise changes in the future state of society and the environment; driving forces that influence these changes, a time horizon, and a storyline. A storyline is a narrative description of a scenario which highlights its main features and the relationships between the scenario’s drving forces and its main features.
In climate change research, scenarios describe plausible trajectories of different aspects of the future that are constructed to investigate the potential consequences of anthropogenic climate change.
Scenarios represent many of the major driving forces - including processes, impacts (physical, ecological, and socioeconomic), and potential responses – that are important for informing climate change analysis.
Responsive Image
Responsive Image

Representative Agricultural Pathways (RAPs)

Representative Agricultural Pathways are scenarios that represent a plausible range of possible futures for agricultural development.
They bring together bio-physical, economic, technology and policy drivers.
RAPs are not meant to be predictions. They consist of a narrative that describe the overall pathway and storylines about how each element may change and why it changes. They represent ‘green’ sustainable future scenarios, ‘grey’, non-sustainable and ‘business as usual”scenarios.
The narratives help to explore how the specific risks and opportunities can be addressed. 
Trends in the RAPs are quantified and the data are used as input for the crop/livestock and economic simulation models.
They provide researchers with a range of plausible scenarios that can be used to simulate possible future outcomes in a consistent and transparent way.
RAP development is an intensive process, and results from many stakeholder interactions.
AgMIP RAPs also act to capture plausible farm-level improvements, as climate change impacts assessments that assume static farm management are generally pessimistic in their lack of development and adaptation (Burton et al., 2001). To better model crops at the farm scale, the economic, technological, and scientific development of each agricultural region will be used to specify plausible regional land use, irrigation, fertilizer and chemical applications, regional shifts in crop species, and improved genetic characteristics of cultivars that may be developed or more widely distributed in the coming decades. These more detailed analyses of adaptation will also improve the capacity to understand potential spatial relocation of crops in response to climate change, using both regional and global economic models.
See also:  https://agmip.org/new-rap/
Responsive Image

Resilience to shocks, enablers and obstacles

RAPs help to understand the drivers and obstacles that affect transition of a farming system.

The ball-and-cup heuristic illustrates the process. The ball represents a system, for instance, a farm or farming system in a specific state. The cup‐shaped landscape represents possible states a system can be in.

A system (the ball) can be pushed beyond a threshold to another state. State (a) has steeper walls and a deeper cup than (c). It is more difficult to move out of state (a). The desired direction is forward (to the right) and upwards.

A ball may be stuck in an undesirable state, for instance a low level of productivity and adaptation. The institutions and policies may not provide sufficient structure for the ball to move upwards to a more desirable state.

Shocks and disturbances, such as climate effects, may ”push” the system out of the cup. A deep cup, strong institutions and enabling policies, prevents the ball from dropping back and better prepares it to continue moving up.

The differences between the expected policies and institutions in the RAPs, lead to different effects on the farming systems.

Sustainable future scenarios, non-sustainable and ‘business as usual’ scenarios show different effects on farming systems.

Responsive Image

National and sub-national (regional) RAPs

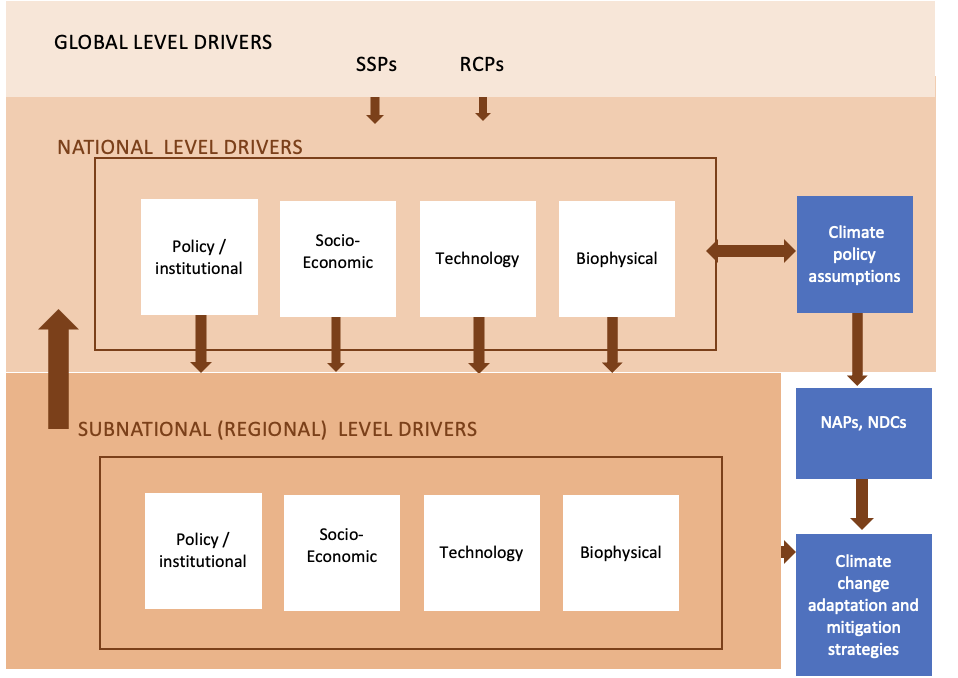
The core of the national RAPs are the policy drivers at national level. These include the shared climate policy assumptions by which a country aims at supporting climate change mitigation and adaptation.

The sub-national (regional) RAPs describe the context specific conditions under which those policies are being implemented.  Sub-national RAPS therefore have more details on the specific socio-economic and environmental characteristics, and technology uptake; in particular farming systems, here crops/livestock.

In the AgMIP CLARE project, the focus is on supporting national agricultural policies in driving local implementation, in particular policies related to climate change. Countries’ visions and plans for agricultural development are integrated with future scenarios to evaluate impacts of climate change and policy interventions

Currently, national policies are on a high level and do not meet specific requirements for regional and local implementation.  Using regional information can help to tailor policies to local contexts and systems.

RAPs: Representative Agricultural Pathways
Responsive Image

Adaptation packages

Adaptation Packages

Modelling outcomes and expert knowledge lead to adaptation options that are discussed with stakeholders.  The resulting range of solutions are the Adaptation Packages. They describe cultivar, management, and agricultural sector policies specifically designed to increase production and resilience as climate changes. These are specific to each region and country and may be compared in the regional and national study pages in the Impacts Explorer.